Data processing pipeline
We have developed a semi-automated data-processing pipeline specifically for NGS experiments (ChIP-Seq, DNase-Seq, RNA-Seq and ATAC-Seq). The pipeline can accommodate datasets from the public domain as well as private ones.
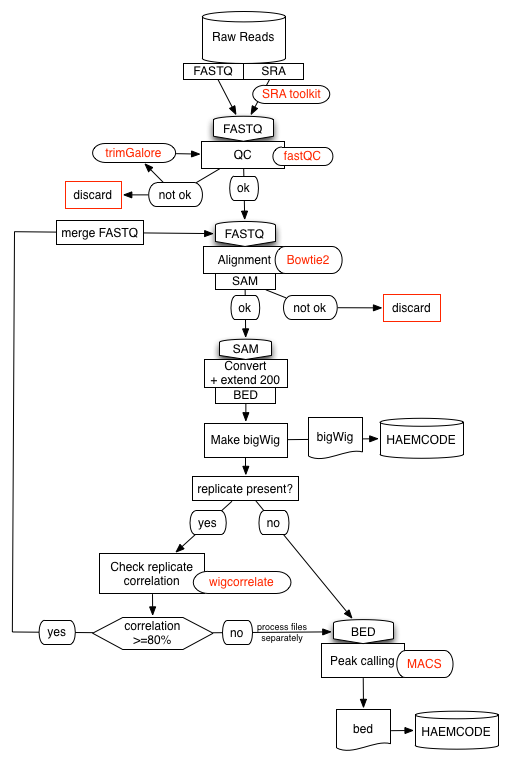
We have made use of several open-source tools to develop our pipelines. Briefly, all the pipelines start by processing the raw data as described below:
- Raw reads in SRA are downloaded and transformed to fastQ format using
fastq-dump. - Reads are then assessed for quality using
fastQC. - Adapters and overrepresented sequences are filtered out using
trimgalore. Samples may be discarded if quality is not satisfactory.
Reads are then aligned using:
Bowtie2for ChIP-Seq, DNase-Seq and ATAC-Seq experiments.STARfor RNA-Seq experiments.
All experiments consider the same genome builds:
- CRGm38 (mm10) for mouse samples.
- CRGh37 (hg19) for human samples.
For transcripton factor ChIP-Seq experiments, aligned reads (in SAM format) are transformed to BED format and all regions are extended to be 200bp long. The resulting reads are then used to generate a density profile in bigWig format using genomeCoverageBed followed by bedGraphToBigWig (bedtools and UCSC tools).
If the experiment is part of a replicate set the different entities are compared using wigcorrelate. If replicates agree at 80% or more, the individual fastQ files are merged and the pipeline rerun from the begining.
For RNA-Seq experiments, we use HTseq to generate a reads-count profile using the UCSC genes as a reference.
For transcripton factor ChIP-Seq experiments we call peaks using MACS2 and a matched control sample (IgG, WCE...) from the same study, when available. We use a p-value threshold specific to each experiment (10-2 to 10-15) that is determined visually by inspecting the ChIP-Seq density profiles. We do not use the q-value (FDR) parameter in MACS2 as this can lead to peaks not being called significant. Finally, we use the BioConductor's ChIPpeakAnno package to generate a list of associated peak-to-genes.